Vzapp what's it?
To get reliable evidence about detailed traffic flow of all types manual traffic surveys are often necessary. This is particularly the case for junctions at crossroads and T junctions as well as for detailed differentiation between foot traffic to heavy traffic. Automatic counting devices frequently reach their limits or are not economically viable for short term surveys. In practise for these surveys tick sheets are commonly used. They entail a high personnel cost for the preparation, carrying out and analysis of the documents.
With Vzapp® these steps will be considerably simplified. The preparation of the traffic survey as well as the analysis are carried out via software on the PC. Commercially available smartphones /tablets based on Android operation systems are used.
1.Preparation
At your disposal is PC Software for the entry of all relevant data. You can administer projects and junctions. Within the junction the geometry of the junction is determined. This includes the number of lanes and chevrons of the individual approaches. At the moment up to 6 arm junctions are covered. Within a junction random numbers can be applied and processed. The basic element for each survey is the counting device. With Vzapp® these can be configured according to the specification of the user. Each counting device can record up to 6 directions/lanes with up to 8 types of vehicle. For each counting device an individual user interface is prepared and a configurations file is generated. This will be designated via USB port or via email to the respective counting device. The preparation for the survey is achieved in this way.
2. Implementation

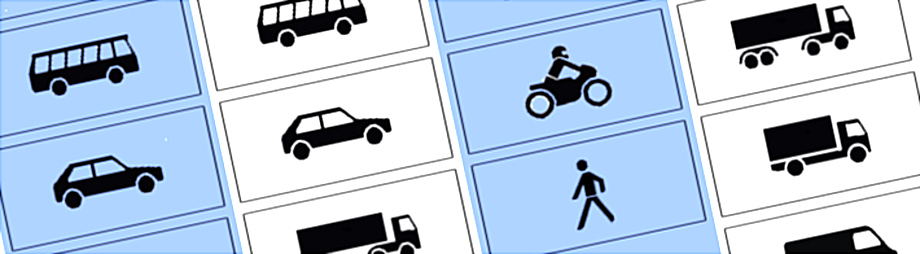
The actual registration of the data is done during the survey by means of the touchscreen of a smartphone or tablet. The Vzapp® application is started as a normal app. The prepared configuration file is uploaded automatically so that the local counters are immediately shown the correct blank file. The mobiles/tablets only register data during the intervals previously determined on the PCs. The travel directions are shown on the screen by means of texts or arrows as directional indicators which can be individually adjusted to the user’s needs. The types of vehicles are shown on the screen as the pictographs commonly used in traffic regulations. Each keystroke is optically confirmed and can be monitored by an activated counter. An optical or haptic feedback can be selected. The end of the survey is indicated to the counter, and the data is automatically saved. Each vehicle is registered as a data set according to type, direction and time.
3. Evaluation
The data is edited in the PC Software Vzapp®. The input of the data takes place via the PC USB port. Alternatively the data can be sent by email. Several models are available for the analysis of the data. In the standard version the data is presented as CSV data according to flow, type of vehicle and time intervals e.g. in Excel. The basic version is aimed at users using other programmes for further processing such as Visum or LISA for example. Other packages offer the possibility of presenting the data in a table or in graphic form within Vzapp®.


Vzapp GbR
Warendorfer Straße 20
D-17192 Waren

+49 3991 18755-33

PDF-Dokument [569.6 KB]
PDF-Dokument [1.7 MB]
